
A fast, cost-effective, scalable monitoring solution and time series database.
VictoriaMetrics is available in binary releases, Docker images, Snap packages, and source code. Just download the latest version of VictoriaMetrics and follow the instructions.
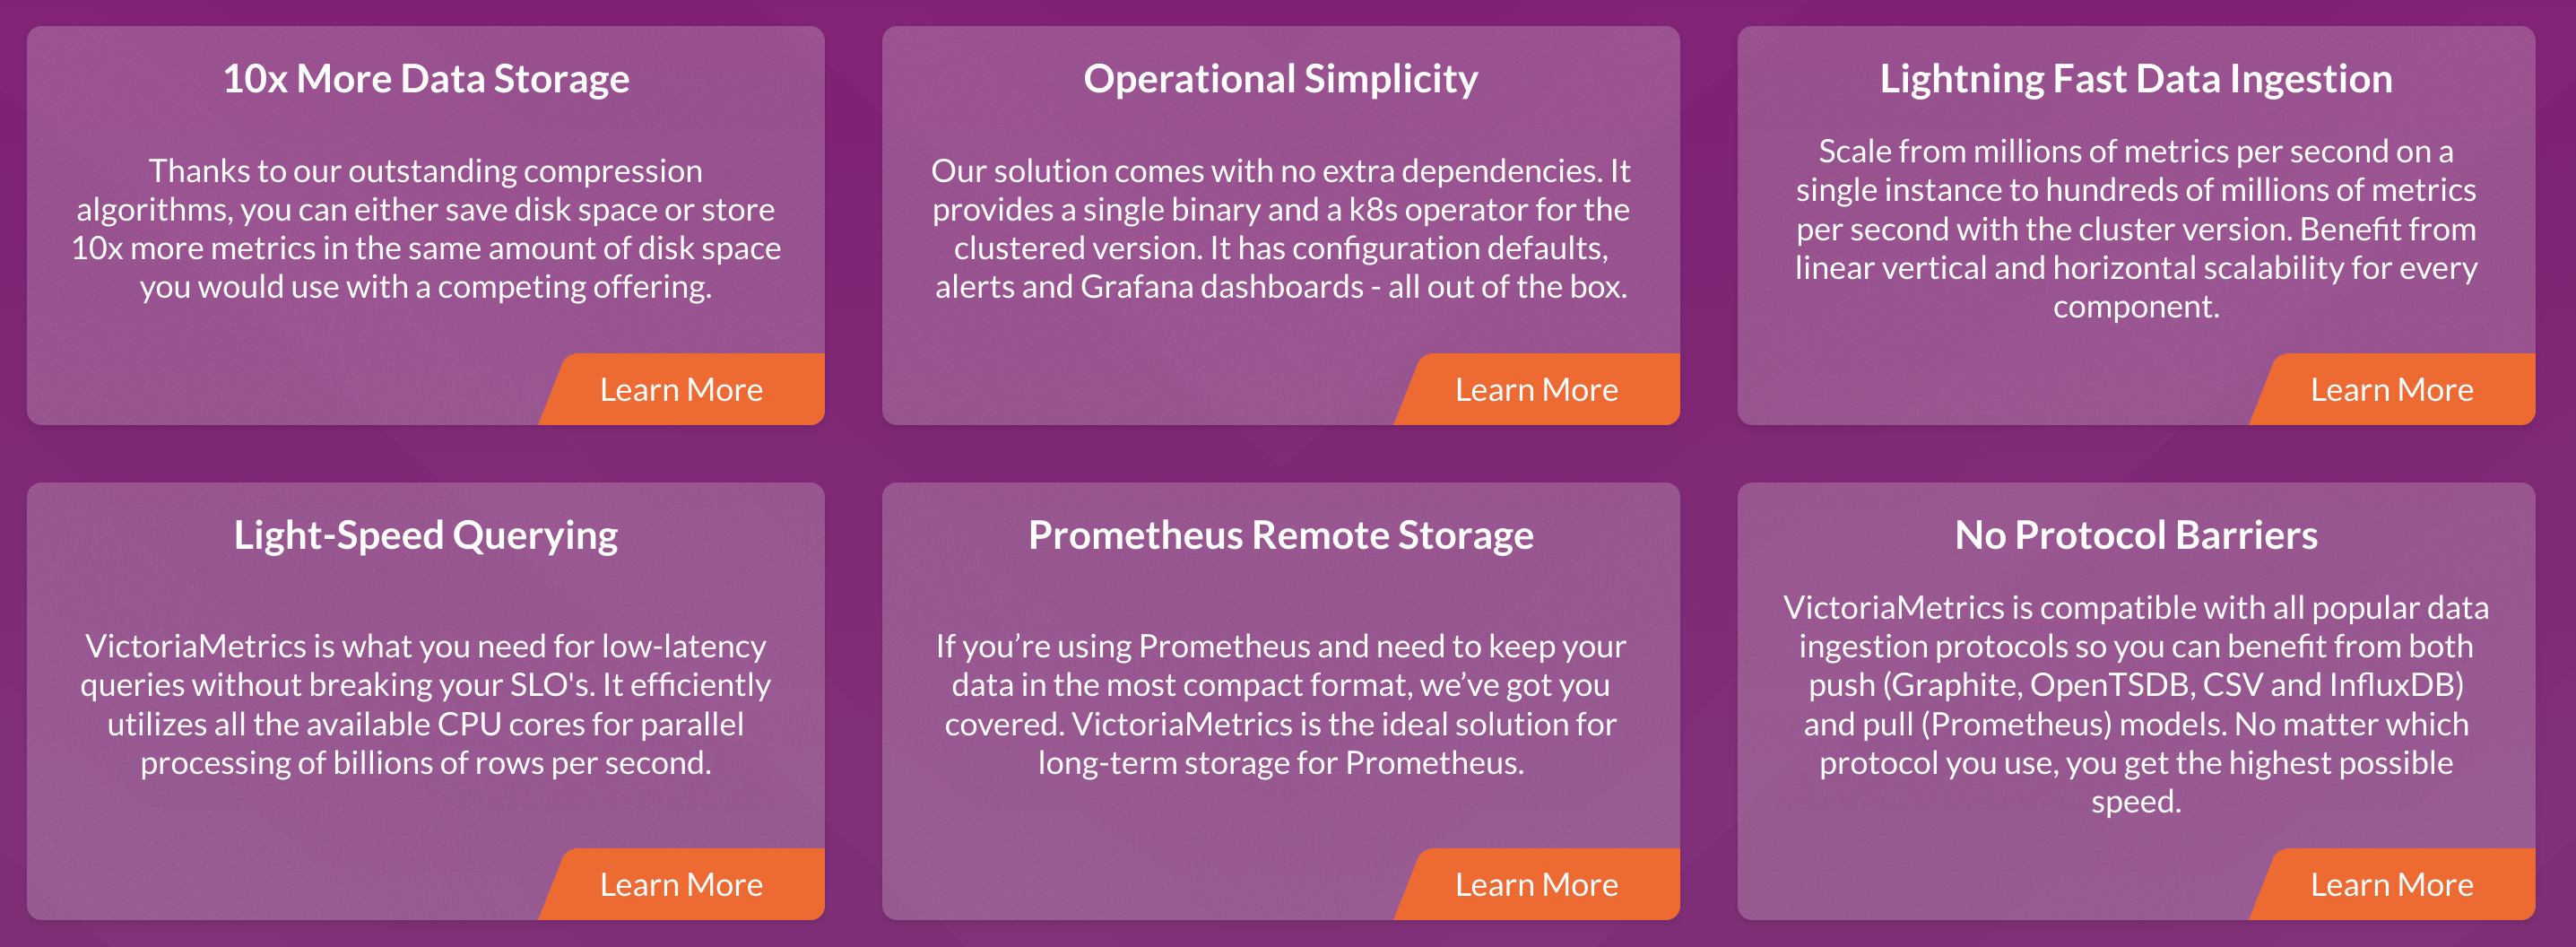
Prominent features of the Golang Application
VictoriaMetrics has the following prominent features:
- It can be used as long-term storage for Prometheus. See these docs for details.
- It can be used as a drop-in replacement for Prometheus in Grafana, because it supports Prometheus querying API.
- It can be used as a drop-in replacement for Graphite in Grafana, because it supports Graphite API.
- It features easy setup and operation:
- VictoriaMetrics consists of a single small executable without external dependencies.
- All the configuration is done via explicit command-line flags with reasonable defaults.
- All the data is stored in a single directory pointed by
-storageDataPaththe command-line flag. - Easy and fast backups from instant snapshots to S3 or GCS can be done with vmbackup / vmrestore tools. See this article for more details.
- It uses 10x less RAM than InfluxDB and up to 7x less RAM than Prometheus, Thanos or Cortex when dealing with millions of unique time series (aka high cardinality).
- It is optimized for time series with high churn rate.
- It implements PromQL-based query language – MetricsQL, which provides improved functionality on top of PromQL.
- It provides a global query view. Multiple Prometheus instances or any other data sources may ingest data into VictoriaMetrics. Later this data may be queried via a single query.
- It provides high performance and good vertical and horizontal scalability for data ingestion and querying. It outperforms InfluxDB and TimescaleDB by up to 20x.
- It provides high data compression, so up to 70x more data points may be crammed into limited storage compared to TimescaleDB, and up to 7x less storage space is required compared to Prometheus, Thanos or Cortex.
- It is optimized for storage with high-latency IO and low IOPS (HDD and network storage in AWS, Google Cloud, Microsoft Azure, etc). See disk IO graphs from these benchmarks.
- A single-node VictoriaMetrics may substitute moderately sized clusters built with competing solutions such as Thanos, M3DB, Cortex, InfluxDB or TimescaleDB. See vertical scalability benchmarks, comparing Thanos to VictoriaMetrics cluster and Remote Write Storage Wars talk from PromCon 2019.
- It protects the storage from data corruption on unclean shutdown (i.e. OOM, hardware reset or
kill -9) thanks to the storage architecture. - It supports metrics’ scraping, ingestion and backfilling via the following protocols:
- Metrics scraping from Prometheus exporters.
- Prometheus remote write API.
- Prometheus exposition format.
- InfluxDB line protocol over HTTP, TCP and UDP.
- Graphite plaintext protocol with tags.
- OpenTSDB put message.
- HTTP OpenTSDB /api/put requests.
- JSON line format.
- Arbitrary CSV data.
- Native binary format.
- It supports metrics relabeling.
- It can deal with high cardinality issues and high churn rate issues via series limiter.
- It ideally works with big amounts of time series data from APM, Kubernetes, IoT sensors, connected cars, industrial telemetry, financial data and various Enterprise workloads.
- It has open source cluster version.
- It can store data on NFS-based storages such as Amazon EFS and Google Filestore.
See also various Articles about VictoriaMetrics.
